Monday, Dec. 28th 2015
Hwee-Boon Yar writes: "I wrote a couple of Ruby scripts and pulled charts from the iOS US app store using RSS feeds from Apple, downloaded the icons and extracted the primary colors used in each icon. I then wrote a Mac app to generate the numbers, charts and tables… The app icons for each chart are then stacked vertically. The taller a column is, the more commonly that color is used for icons in that chart."
Wednesday, Dec. 23rd 2015
"The recent release of Safari 9.0 brought a great new feature: pinned tabs. These tabs are locked to the lefthand side of your tab bar and stay in place, even when you open a new window or relaunch the browser."
Tuesday, Dec. 8th 2015
Nothing new. Just make things work better.
Monday, Nov. 30th 2015
Friday, Nov. 27th 2015
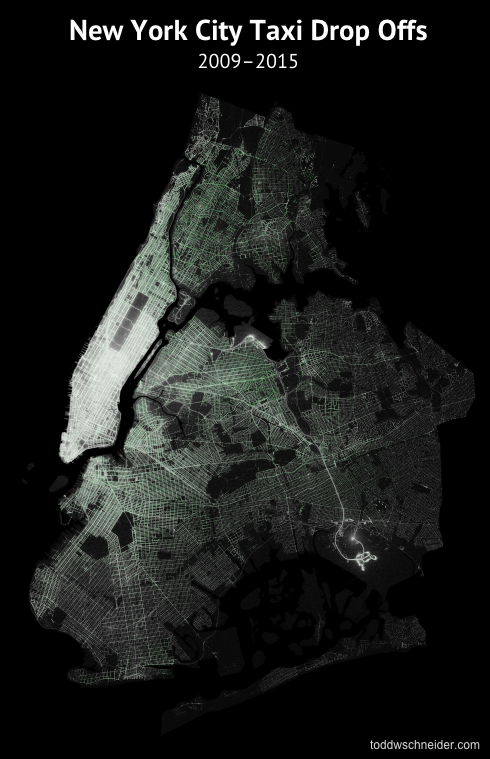
"The New York City Taxi & Limousine Commission has released a staggeringly detailed historical dataset covering over 1.1 billion individual taxi trips in the city from January 2009 through June 2015. Taken as a whole, the detailed trip-level data is more than just a vast list of taxi pickup and drop off coordinates: it’s a story of New York. How bad is the rush hour traffic from Midtown to JFK? Where does the Bridge and Tunnel crowd hang out on Saturday nights? What time do investment bankers get to work? How has Uber changed the landscape for taxis? And could Bruce Willis and Samuel L. Jackson have made it from 72nd and Broadway to Wall Street in less than 30 minutes?"